MOUSE SENSITIVITY CONVERTER / MEASUREMENT GUIDE
Measure cm/360 without false precision
Record the start and end ruler readings for one complete turn, repeat without changing the setup, and keep the individual results. Report the ruler divisions and alignment method alongside the distance. A small difference from a converter is not automatically a converter error: reading bounds and repeat-to-repeat variation must be considered separately.
Published October 20, 2026 · AimConvert · an independent developer
Open the sensitivity converter ↗Write down what you are testing
Record the game and build, hipfire or scoped mode, sensitivity actually retained by the game, active mouse DPI profile, input settings, and the converter inputs. Keep those settings fixed during the sequence. Record the ruler's smallest division and a consistent reference point on the mouse. A calculator output is a model prediction; a ruler observation is a separate piece of evidence.
- Use a safe stationary in-game location and a distinct starting aim reference. Leave enough room for an uninterrupted complete rotation.
- Place the ruler parallel to the intended straight mouse motion. Read the starting position from above rather than at an oblique angle.
- Move through one full turn back to the same aim reference. Keep mouse orientation consistent; changing its angle makes a body reference point a different proxy for motion.
- Record the ending position and subtract the start. If you lift, run out of room or overshoot, mark that trial invalid and restart; do not silently adjust it.
- Repeat from a fresh start and keep every valid reading. Note why any trial was excluded.
A distance uses two endpoint readings
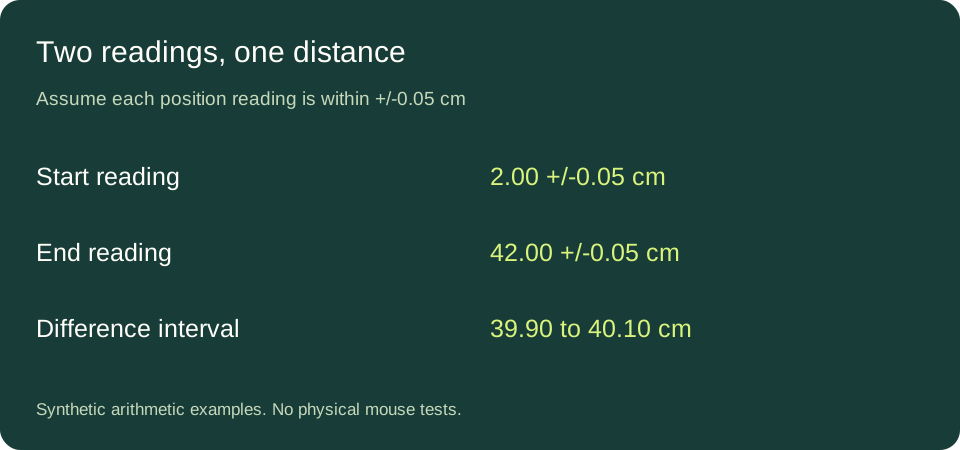
Construct a simple example: a ruler shows a start position of 2.00 cm and an end position of 42.00 cm. Assume, for this calculation only, that each position lies within 0.05 cm of its reading. This is a chosen bound, not a specification for your ruler and not a claim about actual alignment skill. The reported difference is 42.00 minus 2.00, or 40.00 cm.
Largest difference = 42.05 − 1.95 = 40.10 cm
Distance bound from these assumptions = ±0.10 cm
The largest positive difference pairs a high end position with a low start position; the smallest difference pairs the opposite endpoints. This explains why simply attaching the single-position bound of 0.05 cm to the difference would understate this particular worst-case calculation. No probability distribution or confidence level was assumed. These limits cover only the two specified reading bounds, not missed angular alignment, an incorrect ruler scale, or a changed input profile.
The same absolute bound has a different relative size
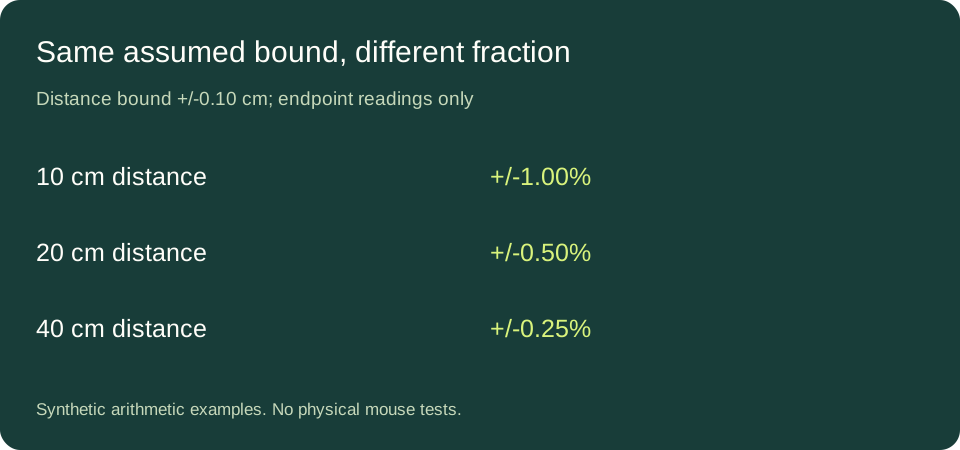
Keep the assumed distance bound fixed at 0.10 cm and change only the nominal full-turn distance. Divide the bound by that distance, then multiply by one hundred. The constructed examples below isolate this arithmetic; they are not a recommendation to change your sensitivity or an experiment showing that one player measures better than another.
| Nominal distance | Calculation | Relative bound |
|---|---|---|
| 10 cm | 0.10 / 10 × 100 | ±1.00% |
| 20 cm | 0.10 / 20 × 100 | ±0.50% |
| 40 cm | 0.10 / 40 × 100 | ±0.25% |
Doubling the denominator halves this relative fraction because the assumed absolute bound stays unchanged. A 40 cm reading and a 40.10 cm prediction are separated by 0.10 cm, which reaches the boundary of this simplified interval. That alone neither validates the converter nor identifies an error. A 40.50 cm prediction lies outside this endpoint-only interval, but another unmodelled influence could still explain the discrepancy. The correct next step is to inspect the setup and the omitted contributions, rather than label the calculator defective.
Repeated readings answer a different question
Now construct five distances: 39.8, 40.0, 40.2, 40.0 and 40.0 cm. Their sum is 200.0 cm, so their arithmetic mean is 40.0 cm. The minimum is 39.8 and the maximum is 40.2; the observed range is therefore 0.4 cm. These numbers were deliberately invented as a reproducible arithmetic dataset. They were not collected from a mouse, player or game.
Sample variance = (0.04 + 0 + 0.04 + 0 + 0) / (5 − 1) = 0.02 cm²
Sample standard deviation = √0.02 ≈ 0.1414 cm
The variance uses deviations from the constructed mean, squares them, and divides by four. This sample standard deviation describes spread in this dataset. It is not the same quantity as the endpoint worst-case bound above, and the two should not be added casually. The range is also not a guaranteed bound for future readings. Reporting only the mean to many decimal places would hide the input spread rather than improve the underlying observations.
For a second counterexample, suppose every distance is shifted upward by a fixed 0.5 cm while its other differences remain unchanged. The new mean becomes 40.5 cm, but the range remains 0.4 cm and the sample standard deviation remains approximately 0.1414 cm. Subtracting the shifted mean cancels the same offset in every deviation. Thus repeatability alone cannot reveal that fixed bias. More repeated readings do not remove an unchanged systematic offset.
A record you can actually compare
Keep a row per trial with start position, end position, difference, validity and notes. Keep the game settings and ruler description with the session, not just a final average. Separate the raw readings from derived statistics. Record a changed DPI profile or a changed aim mode as a new session so that a mixed collection does not look like repeatability evidence.
Direct answers
Does a millimeter ruler guarantee half-millimeter accuracy?
No. Division spacing is not a complete accuracy specification. Reading geometry, scale quality and the turn-alignment procedure also matter. The assumed bounds in our examples must not be copied into your report as measured facts.
Should I round the converter until it matches the ruler?
Keep the original prediction and observations separately. Altering the prediction to match a noisy observation conceals the disagreement. First verify the recorded inputs and the setting the game retained.
Does a perfect conversion round trip settle the disagreement?
No. The round-trip audit checks mathematical consistency, including a counterexample where wrong coefficients cancel. It is not a substitute for independent measurement.
Sources and calculation method
The distinction between assumptions about bounds and a standard uncertainty follows the framework described in NIST's Type B uncertainty guidance. This guide uses an elementary worst-case interval, not NIST's probability-distribution conversion formulas. Endpoint arithmetic was checked with exact rational numbers; sample spread was computed from the disclosed synthetic dataset. No physical tests or universal pass/fail tolerance are claimed.